In policy making, indicators are important for monitoring the status, identifying trends, and measuring progress against existing policy objectives and goals, including the functioning of OSH institutions. Indicators can also serve to monitor new policy initiatives. Finally, indicators may serve as a crystallisation point for discussions on new and emerging topics. Hence, they can play a key role in policy making, since they provide the input to justify policy evaluations, adjustments and improvements. Indicators are essential to provide some feedback to policy makers, OSH institutions and their stakeholders and to compare national OSH policies between countries or with European policies.
The aim of this article is threefold:
To give an overview of the functions and possibilities for national OSH indicators.
To give an overview of already available OSH indicators as presented in the OSH Barometer
To suggest indicators that could be adopted or developed in order to be able to better assess (policies for) safety and health at work at the national level, and perhaps to provide incentives for improvement.
OSH policy makers, both at national and European level are regarded as the prime user group, while the indicators may also be of interest for OSH researchers, OSH experts, and other stakeholders. In the article four types of national OSH indicators are distinguished that can potentially add value to the OSH Barometer. The added value is generated by making relevant national OSH data about existing policies and initiatives better comparable, by identifying trends or measuring progress. They are also useful to monitor and evaluate new policy initiatives and to enable discussions on new and emerging OSH issues. Perhaps the article may contribute to an informal standard for monitoring and evaluation of OSH policies.
For each type of national indicators, it is relevant to ask what relevant indicators are already available (in the OSH Barometer), and what indicators seem useful to develop in the coming years. This article is meant also to provide suggestions for discussions and decision-making about the further development of national OSH indicators in the coming years.
What are national OSH indicators?
An Indicator is something that shows what a situation is like or how it is changing[1]. Indicators are of help when taking relevant decisions. There are several ‘types’ of indicators. There is an important distinction between leading and lagging indicators. Leading indicators are helpful to define solutions, they have predictive value for OSH outcomes. Lagging indicators are important for identifying OSH problems and evaluating OSH investments or improvement activities. There can be qualitative indicators, and quantitative indicators, both have their qualities. Quantitative indicators have as a main advantage that they show a high or low score on the indicator; they are useful to show trends and improvements over time. Qualitative indicators are especially useful for complex issues that are context dependent and cannot easily be measured quantitatively; they are also useful to track the progress in policy initiatives.
Indicators, like models, are always a simplification of reality, and therefore have their inherent limitations. It is important that each indicator has communicative power, i.e., that the meaning of an indicator is relatively easy to understand, and therefore is likely to be used in decision making, e.g., about national OSH policies. It is important that indicators focus on what Juran[2] called ‘the vital few’ which he contrasted with ‘the trivial many’. For indicators the credo ‘less is more’ is valid: less detailed information means less distraction from key issues and better decision making. That also implies that the choice of the indicators (including the definition and the methods for measuring them) are critical for their added-value. It is important to always keep in mind that indicators are a simplification of reality; they are tools for better decision and policy making; they should not be regarded as an aim in itself.
The four main types of national indicators
National OSH indicators can be useful for identifying OSH problems or unfavourable OSH trends. OSH national indicators can also be used to monitor progress in policy implementation or realisation of the aims thereof. Finally national indicators support agenda setting and trigger governments and social partners to discuss hitherto neglected OSH challenges, or to take actions or initiate further investigations. Table 1, below gives an overview of the four functions of national indicators, their aims and characteristics.
Table 1. The four indicator types with aims and main characteristics
Indicator type
Aims
Key characteristics
Remarks
1
Indicators that show the state of OSH,or its determinants and its impacts as well as developments and trends therein
To give insights into the state of OSH
Quantitative lagging indicators that show OSH impacts (outcomes), e.g., in terms of prevalence (and trends) of accidents and diseases or economic impacts, for example the serious accidents rate (per 100,00 workers er year)
The state of OSH is not only determined by national OSH policies, but also by other factors such as economic development
2
Indicators that show what the OSH policiesand capacities of national institutions are like, and how these are developing
To give insights into the national OSH strategies, policies and capacities of national OSH institutions
Quantitative Leading indicators that show the (development of) capacities of national OSH institutions and their key policies. These can be input and process indicators. A typical example is the Labour inspection rate (number of labour inspectors x 100,000 divided by employment)
These indicators are important for monitoring and evaluating national OSH policies, (and perhaps adapt them). An important distinction is between preventive/ proactive policies versus reactive policies
3
Indicators to monitor new policy initiatives.
Showing the progress (or lack of progress) in the implementation of new initiatives and the realisation of their aims.
Qualitative leading indicators, measured during the policy initiative (and perhaps after the formal end of the initiative). Dominantly output indicators. The formal commitment of relevant authorities to the initiative). These indicators can be complemented by indicators of type 1.
When the policy initiative develops to a continuous aim and efforts the indicators can be incorporated into the set of indicators op type 1 and 2.
4
Indicators that serve as a crystallisation point for agenda setting and triggering national policy discussions
Agenda setting and triggering policy discussions on new and emerging issues, or issues that where hitherto regarded as irrelevant
This requires mainly (innovative) quantitative lagging indicators. These are mostly outcome indicators. An example could be the number of work-related suicides
Especially relevant for new and emerging topics.
Depending on the outcome of the discussions triggered, the one-time measurement can be followed up by new (perhaps more reliable) measurements, or not; it can also result in the development of additional indicators of type 1, 2 or 3.
Before becoming more concrete about the areas relevant for choosing and selecting indicators, the quality of data, relevant for the various kinds of national OSH indicators, is discussed.
The quality of the data
Indicators make use of existing or potential data sets. The usefulness of datasets depends on the type of data and the aims and methods used for gathering them.
It is important to be aware that there are a couple of major biases in most OSH data as well as OSH policies: (1) Research is almost always carried out in large organisations. Consequently, we know a lot about the strategies to manage OSH in large companies and how to influence them, but we know relatively little about safety and health in small enterprises. Labour inspections often have relevant information on OSH in SMEs, but these data are usually not publicly available. (2) There is often little if any attention for the positive aspects of good OSH (e.g. doing meaningful work, with opportunities for personal growth and development, and positive impacts on innovation and the national economy) in national OSH policies. Most attention goes to OSH problems/challenges such as accidents and work-related diseases and their prevention. Examples of national OSH strategies which are not well developed are for instance:
positive psychology where it is assumed that there are salutogenic (health generating) factors. Strengthening these factors contributes to better health and wellbeing.
safety II where similarly to positive psychology it focuses on “what goes right” instead of “what can go wrong”.
It should be noted that safety and health at work are in themselves positive concepts however they are usually operationalised measuring negatives, e.g. in terms of risks, accidents and diseases.
There are two main types of national data sets: (1) official, often governmental registers, e.g. for fatal accidents (and other lagging indicators), and (2) data from comprehensive surveys like the European Working Conditions Survey (EWCS)[3] and several national surveys, which usually include data relevant for lagging as well as leading indicators.
Official registers often struggle with under registration, as they depend on notification by companies or OSH experts. Usually the input from small organisations is most problematic as they often do not have an OSH expert, and are often not fully aware of all legal obligations. Registers concerning work-related diseases are often limited to officially recognised occupational diseases (neglecting many work-related diseases). Moreover the lists of officially recognised occupational diseases are not harmonised in the EU, making it very difficult to compare between EU countries.
Datasets from European or national surveys are in principle based on a representative sample of the working population. Besides the obvious fact that you cannot measure work related deaths via surveys, there are three important limitations. The first limitation is that migrant workers, workers who have problems with the language (because they have another mother tongue) or with reading and writing (because they are illiterate) or with the use of computers (smartphones are not very handy for responding to rather long questionnaires) are almost by definition underrepresented. This implies for instance that data relevant for measuring precarious jobs are usually biased, tending to be incomplete and underestimating reality. The second important limitation is that surveys do measure experiences and perceptions and make use of self-reported data; perceptions may differ from reality and the human memory is not always reliable about experiences. This is especially relevant in the case of emerging risks, where the level of awareness on the emerging risks plays a role. A well-known example are the results from surveys on sexual harassment; the datasets suggest that it mainly occurs in Northwest Europe (especially Scandinavian countries) and that it only very seldom occurs in Southern EU countries. Such data are probably mirroring national awareness rather than actual practices. A third limitation is that these surveys are usually representative for the working population, but not for employers. Employers’ surveys are therefore complementary to the general population surveys. However, it is well-known among researchers that employers tend to see OSH through more rosy lenses than their workers or the labour inspection. When measuring for example the commitment of the employer to prevention in OSH, or the percentage of employers that have a reliable risk assessment, employers’ surveys are also biased. In such cases it would be preferable to ask workers about the commitment of their employers in a general survey. The ideal would be to have representative reliable data from a variety of stakeholders.
What areas are relevant for national OSH Indicators for the general state of OSH?
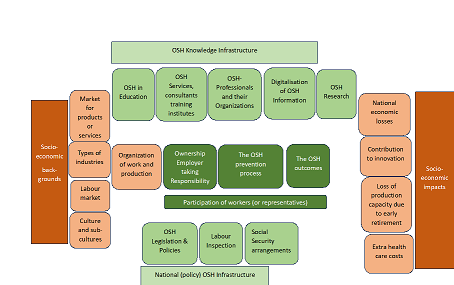
Figure 1. The national OSH overview model (interactions not shown)
Indicators for the general state of OSH serve to get insight into the strengths and weaknesses, and ideally also opportunities and threats of OSH policies and OSH management. As a first step for the development of national OSH indicators for the general state of OSH, it is important to make an overview of the areas of interest where indicators could be useful. Five main areas where national OSH indicators could be relevant can be distinguished. See figure 1. The figure shows (1) the OSH management process – green in the centre – which basically takes place in companies, and here shown in a simplified way. The OSH processes are influenced by (2) the national OSH infrastructure and (3) the OSH knowledge infrastructure (lighter green). OSH policies are part of socio-economic policies and are (4) influenced by the socio-economic situation, which serves as the background of OSH policies, and OSH policies also have (5) socio-economic impacts. These two latter areas are given a beige colour; they are relevant for OSH but are not OSH policy areas.
In the national OSH overview model (Figure 1) we see the OSH process in companies in the centre: the prevention process that is dealing with exposure to existing OSH risks as well as to emerging OSH risks. This leads to OSH outcomes, in terms of accidents and work-related diseases. These lead to socio-economic outcomes.
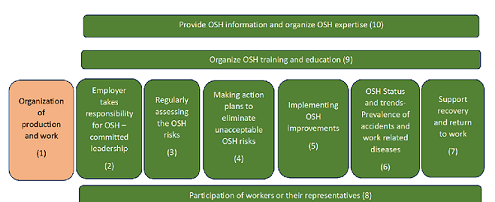
The OSH management process is depicted in more detail in Figure 2.
Figure 2. The OSH management process (interactions now show)
In the EU, the prime responsibility for the OSH management process lies with the employer who is expected to take the lead. The OSH prevention process depicted in figure 1 comprises assessing the OSH risks, making an action plan to eliminate unacceptable risks, implementing OSH improvements, while it also implies participation, providing adequate OSH information and providing OSH education and training. The OSH outcomes are the result thereof and consist mainly of the OSH status and trends therein, usually expressed in the prevalence of work-related accidents and diseases. The organisation of production and work is also of high relevance for OSH, but often it is seen as predominantly a socio-economic area, though the OSH process may lead to changes (corrections) in this area. The OSH management process shown in more detail in figure 2, is where the OSH process happens. In figure 2 ten areas are distinguished: on the left it starts with (1) the organisation of production and work. This area is given the colour of the socio-economic areas, as it often NOT regarded as a key factor in the OSH process (e.g., there are no legal obligations in the EU for OSH in the design stage, usually the employer takes the decisions) but as many of the hazards and risk are determined in this stage it would be interesting (but difficult) to develop an indicator for this area. Then we have (2) the employer taking up the responsibility for the OSH process and its organisation. This will be important for all other steps: the (3) process of assessing the risks, (4) making an action plan to improve OSH, (5) implementing the improvements according to the action planning, resulting in (6) OSH status and trends- expressed in the prevalence of accidents and work related diseases, as last step in the OSH process there is the area of (7) support and recovery of workers involved in accidents or a work-related disease. The steps 2 -7 would require (8) participation of the workers or their representatives, (9) OSH training and education and (10) the provision of OSH knowledge and information.
Choice of priority areas for developing National OSH indicators
In this section the areas mentioned in figure 1 and 2 are evaluated on their relevance for national indicators. The five clusters presented in figure 1 are thereby considered successively, while the more detailed figure 2 will be used for evaluating the areas in the cluster that can be regarded as the ‘heart’ of the OSH management process. This will result in a choice of areas that require indicators, and simplified versions of figure 1 and 2.
National OSH policies are in fact part of broader socio-economic policies. This means there are important relationships of OSH processes with other socio-economic factors and policies[4]. That explains why two of the clusters are of a socio-economic nature: the socio-economic backgrounds are co-determinants of the OSH Management process, while the OSH processes also have significant socio-economic impacts. The cluster with Socio-economic backgrounds comprise four areas: (1) the national market for products & services, (2) the types of industries in the country, (3), the national labour market, and (4) national culture and subcultures. These areas form important backgrounds for the OSH process; but they do not form the core of the OSH process. From these four areas the most direct impact on the OSH process stems from the labour market; the types of industries are the second most important area in the socio-economic sphere. It therefore makes sense to develop OSH indicators for these two areas that are relevant for the OSH process.
Figure 1 also shows four areas that concern the socio-economic impacts of OSH: (I) national economic losses, (II) loss of production capacity due to early retirement, (III) extra health care costs, and (IV) contribution to innovation. The latter area is included to emphasize that OSH processes not only have negative socio-economic impacts, but can also have positive socio-economic impacts. The first three of these areas are not fully independent, as the loss of production capacities and health care costs are actually examples of national economic losses. The national economic losses and the loss of production capacities due to early retirement and disabilities to work seem most relevant and relevant indicators should be defined.
The other two clusters in figure 1 around the core OSH process, are called in this article respectively the national OSH (policy) infrastructure and the OSH knowledge infrastructure. The OSH (policy) infrastructure comprises (a) the OSH legislation and policies (and the institutes and social partners that are involved in OSH policy making), (b) the labour inspection, and (c) the national social security arrangements. While one can discuss whether the national social security arrangement belong to the OSH area or to the socio-economic area, they are in most countries directly involved in OSH[5], and therefore regarded here as part of the OSH infrastructure. As each of the three areas of the national OSH infrastructure have a major impact on the OSH processes, all three deserve national indicators.
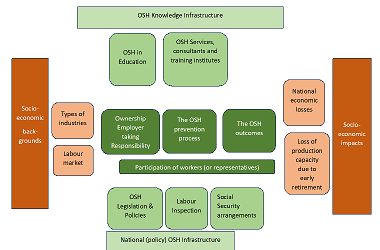
Figure 3. The simplified model of the OSH infrastructure with key areas for national indicators
The OSH knowledge infrastructure comprises in figure 1 five areas: (A) OSH in education, (B) OSH services, consultancies, and training institutes (C) OSH professionals and their organisations, (D) availability and digitalisation of OSH information, and (E) OSH research (institutes). These five areas are not equally relevant, and at least two areas would require national indicators: (A) OSH in education, because what is learned at a young age is likely to influence OSH during all stages of working life, and (B) the OSH services and consultancies.
National OSH indicators for the general state of OSH are important for monitoring the status, identifying trends, and measuring progress against existing policy objectives and goals, including the functioning of national OSH institutions. The above implies the intention to select, develop or suggest national OSH indicators for a limited number of prioritised areas. An overview of the selected areas for the socio-economic and OSH infrastructure areas is given in figure 3.
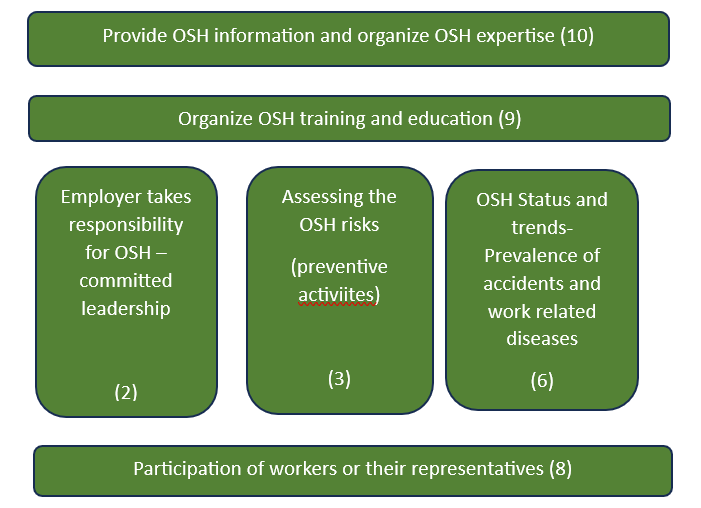
In principle it would be valuable to have indicators for each of the ten areas of the OSH management process, but for area (1) it will be very difficult to develop a good indicator and that is also the case for (5) implementing the improvements, while the action plan (4) is closely connected to the risk assessment, and area (7) is least relevant – it is mostly reactive. Like figure 3, the selected key areas for national indicators of the OSH management process are depicted in figure 4.
Figure 4. The simplified model of the OSH Management process with key areas for national indicators
Criteria for the selection or development of national OSH indicators
The selection of OSH indicators is essential as it has important consequences.: The indicators should serve to get an overview of essential factors. It is thereby important that many relevant factors do not concern just one of the boxes in the figures. As in each socio-technical system the relationships between the various ‘elements’ in a system are more important for the functioning of the whole than the functioning of the elements as such. As there are many potentially interesting relationships, this strengthens the need to be selective in choosing the indicators. It is important to measure each of the indicators in a standardized way, as objectively as possible. In the selection process the following criteria will be useful:
Factors that have a major influence on OSH at national level.
Factors that clearly have a relationship with the OSH management process or the OSH outcomes
Factors that are not too complex to measure more or less objectively, e.g., where relevant data are already available
Factors that are already recognised as important indicators by international institutions such as the ILO
Factors that are relatively easy to understand and have a good communicative power (and may support dialogue between OSH policy makers)
There are two possible strategies to select or develop a useful set of national OSH indicators: the pragmatic approach and a more principal approach.
Table 2. Two distinct strategies for developing of choosing as set on national OSH indicators
Strategy for developing a set of national indicators
How indicators are defined
What data are used
Time perspective
Pragmatic approach
Indicators are derived from existing data sets
Available data sets are used and processed
Indicators can be produced at short notice
More principle approach
The relevance of the indicators is the main criteria
Data may be available, but it may be necessary to develop additional (reliable) data
Before indicators can be produced, new or additional data have to be produced; indicators will become available in mid or long-term
It is logical to start with indicators that are already available (e.g. already included in the OSH Barometer), or can be easily derived from existing data sets (the pragmatic approach). In the longer run, the set of indicators can then be gradually be improved and expanded, following the principal approach.
Suggestions for national OSH indicators for the two socio-economic clusters
In this section indicators that represent socio-economic determinants and socio-economic outcomes (Type 1) are further selected and defined. The most important national indicators for the two socio-economic clusters are the indicators for the types of industry and for the national labour market. See table 3.
Table 3. Suggested National indicators for the cluster socio-economic backgrounds
Area
Reasons
Proposed Indicator(s) already available
Proposed additional indicators
Measurement of/ Reference for additional indicators
The types of industries in the country
The types of industries define to a high degree the type of jobs as well as the hazards and risks of production and work
Employment per sector; Already in OSH Barometer
--
-
The national labour market
The position in the labour market is an important determinant of OSH risks in the job. The weaker the position of workers the higher the risks
Percentage of migrant workers using data from EWCS
Proportion of workers of foreign origin or background[7]
The indicators for the socio-economic outcomes, i.e. for the national economic losses and the loss of production capacities due to early retirement and work-related disabilities are presented in table 4.
Table 4. Suggested national indicators for the cluster socio-economic impacts.
Measurement of /Reference for additional indicators
National economic losses
Economic performance is a key in national socio-economic policies. The economic impact of OSH is so far usually almost invisible. Therefore, the economic arguments for improving OSH remain often unused or underused
-
Economic burden of work injuries and diseases expressed in percentage of GDP
Using the framework developed by Tompa et al[8]. This method is based on the ‘bottom-up’ approach developed in the EU OSHA 2019 report (chapter 2)[9].
In this methodology three broad categories of costs are included: Direct healthcare cost, indirect productivity losses (e.g. because of sickness absence), and intangible health-related quality of life costs.
Loss of production capacities due to early retirement and work-related disabilities
People that are no longer able to work till the normal national age of pensioning imply a serious loss of economic production capacity, and greater scarcity of experienced workers at the labour market
-
Workability forecast
Developed by FIOH, but not yet used for national surveys[10].
Suggestions for national OSH indicators for the OSH policy and knowledge infrastructure
Suggestions for national OSH indicators for the OSH (policy) infrastructure are mostly leading indicators that give information on the capacities and activities of the institution that are part of the OSH (policy) infrastructure. The indicators for OSH legislation and policies, Labour Inspection and social security arrangements are presented in table 5.
Table 5. National indicators for the OSH (policy) infrastructure
Area
Reasons
Proposed Indicator(s) already available
Proposed additional indicators
Measurement and Reference for additional indicators
OSH legislation and policies
OSH legislation is key in EU OSH policy, but can be implemented in different ways and speed in the Member States. This may have consequences for the implementation at the company level. As the OSH legislation is primarily directed at employers the growing number of self-employed and informal workers is a concern.
A lot of information is available on the OSH Barometer, but not in the form of an indicator
The percentage of recent (new or adapted) EU requirements implemented nationally?
The labour inspection is an important institution for enforcement of OSH legislation, but also for promoting awareness about OSH and the associated legal requirements
A lot of information enforcement capacity is available on the OSH Barometer, but not in the form of this indicator
The labour inspection rate = the L.I. capacity per number of employed people
Number of labour inspectors x 100,000Employment[13]
-
Degree of proactivity of labour inspection activities
Man hours dedicated to own priorities (e.g. planned inspections or promotion activities)/ man hours spend on reacting to reported accidents + work-related diseases + complaints.
This indicator is in use by the Dutch Labour Inspection
Social security arrangements
The national social security arrangements ensure that people who are affected by an accident or work-related disease and are therefore temporarily or permanent unable to work still have a decent income. This also implies that e.g. social security agencies have an economic incentive to invest in prevention.
Share of workers covered in the event of occupational injury (at the level of enterprises, the OSH management process requires other indicators. The may include (proactive) leading indicators[14],[15] as well as lagging indicators)
Share of workers covered in the event of a work-related disease[14],[15]
Workers protected by insurance of work-related diseases x 100,000 / Employment
Similar to workers covered in the event of an occupational injury
Degree of prevention activities
(note: this may vary per sector)
Percentage of money spent on (primary) prevention as percentage of money spent on compensation
Data required from the respective social security agencies
Suggestions for national OSH indicators for the OSH knowledge infrastructure for OSH in education, OSH services, consultancies and training institutes are presented in table 6.
Table 6. National indicators for the OSH knowledge infrastructure
Area
Reasons
Proposed Indicator(s)already available
Proposed additional indicators
Measurement of/ Reference for additional indicators
OSH in education
OSH in the curricula for education is important because it implies that people are better prepared to deal with OSH risks during their career. It is important to be competent at the start of a job. This is especially relevant because employment relations are increasingly fragmented (self- employed, temporary contracts, etc.) which implies that employers will be reluctant to provide OSH education and training
-
Extend of formal integration of OSH into curricula (vocational education; business schools)
The data are not easily available. It may require a dedicated project[16].
OSH services, consultancies, and training institutes.
OSH services and consultancies are key in providing employers and workers with OSH knowledge. Their knowledge and advice can contribute significantly to prevention.
OSH services rate
(similar to labour inspection rate)
The number of OSH professionals in OSH services and consultancies x 100,000 divided by workforce
Degree of focus on (primary) prevention of OSH services and consultancies
Man hours dedicated to primary prevention / man hours spent on reacting to investigate accidents or return to work activities
Suggestions for national OSH indicators for the OSH Management process
The OSH Management process is influenced by the national OSH infrastructure and the national OSH knowledge infrastructure[14],[15], as well as the socio-economic background factors. The national indicators for the OSH management process are employer engagement with the OSH process and its organisation, The assessment of risks, OSH status and trends expressed in the prevalence of accidents (safety), work-related physical diseases (health) and mental diseases (mental health or wellbeing), Participation of workers or their representatives, OSH training and education, and the provision of OSH knowledge and information.
The information on these suggested indicators is presented in table 7.
Table 7. National indicators for the OSH Management process
Area
Reasons
Proposed Indicator(s) already available
Proposed additional indicator(s)
Measurement of and reference for additional indicators
Employer engagement with OSH process and its organisation.
The prime responsibility for OSH lies with the employer. When the employer is committed to take care of OSH that is an important stimulus for the rest of the OSH management process.
Management commitment to prevention (according to the workers)
Survey question: The management of our company is truly committed to prevent all accidents and work-related diseases.
Four response options: ‘Strongly disagree’, ‘Disagree’, ‘Agree’ and ‘Strongly agree’
(variation of question used in Zwetsloot et al.[17])
Assessment of OSH risks
Risk Assessment is a key obligation in the EU. Risk assessment also forms the basis for defining prevention activities
Percentage of organisations regularly updating adequate OSH Risk Assessments
Probably data from labour inspections are the most reliable (Data from employers’ surveys give significantly higher percentages than figures from labour inspections and are not very reliable; employers are frequently quite optimistic about the quality of the risk assessments. Data from ESENER on regular risk assessments are higher than those from EWCS.).
OSH Status and trends- expressed in the prevalence of accidents (Safety)
The OSH risks ultimately result in OSH performance in terms of the prevalence of work-related accidents and diseases. It is especially relevant to monitor trends and status of irreversible impacts such as death and disabilities due to injuries and diseases.
Serious accidents per 100,000 workers per year[18]
OSH Status and trends- expressed in the prevalence of work-related physical diseases (Physical health)
Fatalities due to work-related physical health issues (According to WHO & ILO[19] structural long working hours >55 hours per week) are the main cause of work-related death)
Prevalence of work-related diseases – all disease groups- dalys
Dalys per 100,000 workers
(not yet graphically presented)
OSH Status and trends- expressed in the prevalence of work-related mental diseases (mental health)
Number of work-related suicides
European countries have data on the prevalence of suicides, but not yet for work-related suicides. The criterion for work-related suicides would be: work or employer mentioned in farewell letter or suicide committed at employer’s premises). European national data is not yet available (different from e.g. US, Japan, etc.) but there are certainly relevant cases. Data on work-related suicide are also relevant given the interest of national and European policy makers in Vision Zero).
Participation of workers or their representatives
Participation is part of OSH legislation. It is key for fine tuning prevention activities and it also implies the recognition for people that their experiences and opinions matter.
Employees reporting the existence of a health and safety delegate or committee. Based on EWCS data[20]
OSH training and education
It is a key obligation for the employer to provide OSH training and education to the workers. To make sure they know the risks associated with their job and how to deal adequately with them.
Percentage of workers that received formal OSH training in the last year
Or number of ours OSH training per worker per year?
Access to employer provided training (percentage of employees) using data from the EWCS[21]
The provision of OSH knowledge and information
Having relevant OSH information or knowledge available when people are at work is essential for dealing adequately with OSH risks. Openness and transparency about OSH risks and relevant factors is also a key characteristic of a strong culture of prevention.
Proportion of workers not informed about health and safety risks
Proportion of workers not informed about health and safety risks, by workplace size, EU28 (%)
National OSH indicators to monitor the progress of new policy initiatives
An example of a new policy initiative is the ETUC initiative the Zero Death Manifesto[23] . The confederation of European Trade Unions made a call to the European Union, its member state governments and employers to genuinely commit and take the action needed to achieve zero deaths at work. By making it a time-bound ambition they mention 2030 as the date to achieve zero deaths at work.
The ETUC website shows which relevant EU Member State ministers from have undersigned their manifesto (11 ministers at the time of writing this article). The website also shows that 65 Members of the European Parliament have so far undersigned the manifesto. The number of signatures from ministers and MEPs can be regarded as qualitative indicators. This is, however, limited to formal personal commitments of authorities, and gives no insight whether there are relevant national policy initiatives or the impact in the respective countries.
In principle it would be possible to use indicators to monitor, measure and communicate the impact of the manifesto on policy actions undertaken, while they could ultimately also result in the lagging indicators of type 1 which are relevant for zero death at work.
Table 8. A proposed framework of qualitative indicators for measuring the impact of a policy initiative per country - applied to ETUC's Zero Death Manifesto (2022)
Monitoring progress of the initiative (example The Netherlands)
Formal commitment of relevant authorities to the policy initiative
Formal national strategy to implement the policy initiative
Some first concrete actions undertaken to implement the initiative
Several actions undertaken to implement the initiative more structurally
Achievement of aims and objectives (using data about the prevalence of fatal accidents, and death due to work related diseases) – using lagging indicators (number of deaths at work)
Signature by competent Minister (2022)
Publication of the strategic policy document Arbovisie 2040 adopting zero death[24]
The highlighted text shows the progress. In the example only the first steps have been made so far.
The measurement of qualitative indicators requires defining upfront the potential or available sources of data. In the example above these qualitative data are national policy documents, and documents on program implementation or program initiatives. The data could be delivered and analysed by the national focal points. It is also possible to use reports from national or international stakeholder meetings.
A more comprehensive policy initiative relevant to monitor progress and impact would be the EU Strategic Framework on Health and Safety at Work 2021-2027[25]. The Strategic Framework takes a tripartite approach — involving EU institutions, Member States, social partners and other stakeholders — and focuses on three key priorities:
anticipating and managing change in the context of green, digital and demographic transitions;
improving the prevention of work-related accidents and diseases, and striving towards a Vision Zero approach to work-related deaths;
increasing preparedness to respond to current and future health crises.
For each of these three key priorities the proposed framework for monitoring progress can be used.
Table 9. A proposed framework of qualitative indicators for measuring the impact of the EU Strategic Framework on Health and Safety at Work 2021-2027
Monitoring progress of the EU Framework
Key priority
Formal commitment of relevant authorities to the policy initiative
Formal national strategy to implement the policy initiative
Some first concrete actions undertaken to implement the initiative
Several actions undertaken to implement the initiative more structurally
Achievement of aims and objectives
Anticipating and managing change
Improving prevention and striving towards zero work-related deaths
Increasing preparedness for future health crises
According to the strategy, the implementation of each of the EU’s three key objectives will be underpinned by: (i) social dialogue; (ii) strengthening of the evidence base; (iii) strengthening of enforcement; (iv) awareness raising; and (v) funding. In principle it is also possible to monitor progress and achievements in terms of these five perspectives. The data can be gathered in workshops with stakeholders. It is important to take into account that such qualitative indicators can be used and understood in various ways limiting the comparability between the individual countries. It is most important to reach consensus among national stakeholders.
National Indicators as crystallisation points for agenda setting
National OSH indicators that may serve as crystallisation points for policy discussions and agenda setting are often lagging indicators. These will generally refer to new and emerging OSH topics or risks or serve to develop a non-traditional but meaningful perspective on OSH. Three suggestions are made: the percentage of workers that work structurally more than 55 hours per week (including paid and non- paid overwork), the number of work-related suicides (already mentioned earlier), and the percentage of workers having the feeling that they never or very rarely do useful work. Note that both the 55+ hours and work-related suicide are relevant for the goal of zero work-related deaths, mentioned among others in the EU strategic Framework 2021-2027[25].
Table 10. Two suggestions of national indicators for triggering policy discussions and agenda setting
Examples of national indicators for triggering discussions and agenda setting
Relevance
Reference
Percentage of workers that work structurally more than 55 hours per week (including paid and non-paid overwork)
Long working hours (i.e., more than 55 hours per week) is globally the main factor causing work-related deaths - often due to stroke; this is also relevant for the aim of zero deaths
European countries have data on the prevalence of suicides, but not yet for work-related suicides.
The criterion for work-related suicides would be: work or employer mentioned in farewell letter or suicide committed at employer’s premises) [criterion used in Japan]
Percentage of workers having the feeling never or very rarely to do useful work
This factor may lead to a lot of frustration during work which triggers mental health issues
[6]Padrosa, E., Bolíbar, M., Julià, M., Benach, J, 2021. Comparing Precarious Employment Across Countries: Measurement Invariance of the Employment Precariousness Scale for Europe (EPRES-E). Soc Indic Res154, 893–915 (2021). https://doi.org/10.1007/s11205-020-02539-w
An example of how this indicator can be presented is given in the European Working Conditions Survey of 2015, Figure 18 on page 28. The EWCS 2015 covered the 28 EU Member States, the five EU candidate countries (Albania, the former Yugoslav Republic of Macedonia, Montenegro, Serbia, and Turkey), as well as Switzerland and Norway.
[8] Tompa, E., Mofidi, A., van den Heuvel, S., van Bree, T., Michaelsen, F., Jung, Y., Porsch, L., van Emmerik, M., 2021. Economic burden of work injuries and diseases: a framework and application in five European Union countries, BMC Public Health, 2021. https://doi.org/10.1186/s12889-020-10050-7. See table 2 on page 6.
[14]ISSA, 2020. Zwetsloot, G.I.J.M., Leka, S., Kines, P., Jain, A., authors. Vison Zero - Proactive Leading Indicators – A Guide to measure and manage safety, health and wellbeing at work. Geneva: International Social Security Association. Available via: https://visionzero.global/guides
At the level of enterprises, the OSH management process requires other indicators. This may include (proactive) leading indicators (ISSA, 2020, Zwetsloot et al, 2020) as well as lagging indicators.
[15] Zwetsloot G.I.J.M., Leka S., Kines P., Jain A., (2020). Vision zero: Developing proactive leading indicators for safety, health and wellbeing at work. Safety Science 130 (2020), 104890. https://doi.org/10.1016/j.ssci.2020.104890
[16] Bollmann, U., 2023. In an e-mail to the author; 28 September.
[17] Zwetsloot GIJM, Kines P, Ruotsala R, Drupsteen L, Merivirta ML, Bezemer RA, 2017. The importance of commitment, communication, culture and learning for the implementation of the zero accident vision in 27 companies in Europe, Safety Science 96, 22-32. https://doi.org/10.1016/j.ssci.2017.03.001
[19]WHO/ILO (2021). Joint estimates of the work-related global burden of disease and injury 2006-2016 – global monitoring report. Geneva: World Health Organisation and International Labour Organisation. Available at: https://www.who.int/publications/i/item/9789240034945
An example of how this indicator can be presented is given in the European Working Conditions Survey of 2015, Figure 57 on page 73.
The EWCS 2015 covered the 28 EU Member States, the five EU candidate countries (Albania, the former Yugoslav Republic of Macedonia, Montenegro, Serbia, and Turkey), as well as Switzerland and Norway.
An example of how this indicator can be presented is given in the European Working Conditions Survey of 2015, Figure 70 on page 84.
The EWCS 2015 covered the 28 EU Member States, the five EU candidate countries (Albania, the former Yugoslav Republic of Macedonia, Montenegro, Serbia, and Turkey), as well as Switzerland and Norway.
An example of how this indicator can be presented is given in the European Working Conditions Survey of 2015, Figure 59 on page 74, where it is presented for the European averages per size category. The EWCS 2015 covered the 28 EU Member States, the five EU candidate countries (Albania, the former Yugoslav Republic of Macedonia, Montenegro, Serbia, and Turkey), as well as Switzerland and Norway.
[26]Soffia, M., Wood, A. J., & Burchell, B., 2022. Alienation Is Not ‘Bullshit’: An Empirical Critique of Graeber’s Theory of BS Jobs. Work, Employment and Society, 36(5), 816–840. https://doi.org/10.1177/09500170211015067
[27]An example of how this indicator can be presented is given in the paper from Soffia et al titled Alienation Is Not ‘Bullshit’: An Empirical Critique of Graeber’s Theory of BS Jobs. Work, Employment and Society, 36(5), 816–840. https://doi.org/10.1177/09500170211015067. See figure 2 on page 826.
It is based on a secondary analysis of data gathered for the European Working Conditions Survey of 2015.